Is Bitcoin preparing for another explosive rally, or is this the beginning of a deeper correction? The 4-hour chart reveals that beneath the recent pullback, the bulls may still have the upper hand. Here’s the technical evidence every trader and investor should understand before making their next move.
Market Structure Analysis
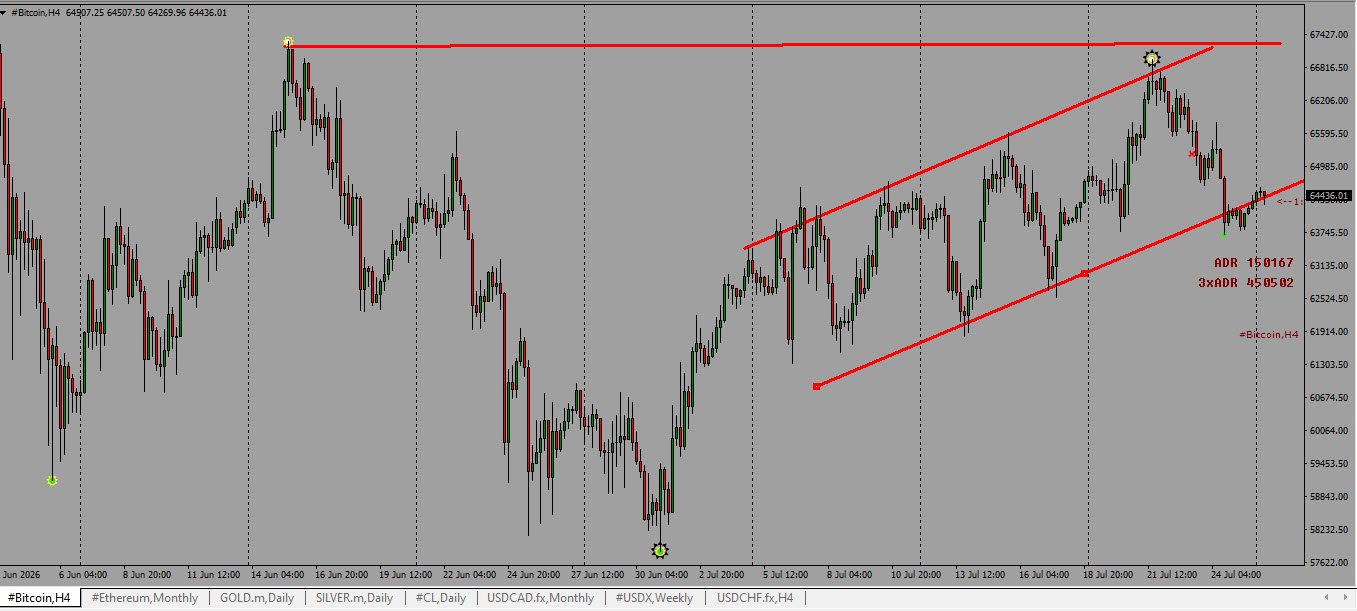
From the chart, Bitcoin is trading inside an ascending channel, which is one of the strongest continuation patterns in technical analysis.
The chart shows:
- A sequence of higher highs (HH) and higher lows (HL).
- Price respecting the ascending trendline that has acted as dynamic support.
- Buyers stepping in each time Bitcoin revisits the lower boundary of the channel.
- A rejection near a major horizontal resistance around 67,200, followed by healthy profit-taking.
Technically, this is still considered a bullish market structure.
Why the Trend is Still Bullish
1. Higher Highs and Higher Lows
One of the simplest definitions of an uptrend is:
- Higher Highs
- Higher Lows
Looking at the right side of the chart:
- Bitcoin created several higher lows.
- Buyers continued pushing price toward new highs.
- The recent decline has not broken the previous swing low.
Therefore, the trend has not changed.
2. Ascending Channel
The red trendlines form an ascending channel.
This tells us:
- Buyers remain in control.
- Sellers can only produce temporary corrections.
- Price is respecting both support and resistance within the channel.
Until price closes convincingly below the lower trendline, the bullish structure remains valid.
3. Resistance Held
Bitcoin attempted to break approximately 67,200 but failed.
This area acted as:
- Previous swing high
- Psychological resistance
- Profit-taking zone
The rejection is normal after a strong rally and does not automatically signal a bearish trend.
4. Healthy Pullback
Markets do not move in straight lines.
Every sustainable uptrend experiences corrections.
The recent decline appears to be a retracement rather than a reversal because:
- Price remains above the ascending support.
- No lower-low has formed.
- Buyers quickly reacted after the sell-off.
Important Technical Levels
Major Resistance
67,200
A strong close above this level could trigger another bullish leg toward fresh highs.
Immediate Support
Around 64,200–64,500
Price is currently finding buyers near this area.
Dynamic Support
The lower ascending trendline.
As long as price stays above this trendline, buyers retain the advantage.
Bullish Scenario
If Bitcoin:
- Holds above the ascending trendline,
- Continues making higher lows,
- Breaks above 67,200,
the next move could extend toward a new swing high.
Momentum traders would interpret this as a continuation breakout.
Bearish Scenario
The bullish outlook becomes weaker if:
- Price closes decisively below the ascending channel.
- A lower low forms beneath the recent swing low.
- Selling volume increases significantly.
That would suggest a possible change in market character from bullish to bearish.
Trading Strategy
Strategy 1: Buy the Pullback
Rather than chasing price at resistance:
- Wait for Bitcoin to revisit channel support.
- Look for bullish confirmation (bullish engulfing candle, hammer, or strong rejection).
- Enter long positions after confirmation.
- Place stop-loss below the recent swing low.
- Target the previous high near 67,200, then trail the stop if a breakout occurs.
Strategy 2: Buy the Breakout
If Bitcoin closes strongly above 67,200:
- Wait for a retest of the breakout level.
- Enter after the retest holds.
- Use the broken resistance as new support.
- Target the next major resistance or new all-time swing highs.
Risk Management
Regardless of the strategy:
- Risk only 1–2% of your trading capital per trade.
- Avoid buying directly into resistance without confirmation.
- Always use a stop-loss.
- Aim for a minimum Risk-to-Reward Ratio (RRR) of 1:2 or better.
Consistent risk management is often more important than predicting every market move correctly.
Key Takeaways for Investors
The current pullback should not automatically be interpreted as the start of a bearish market. From a technical perspective, Bitcoin is still respecting a bullish market structure characterized by higher highs, higher lows, and an ascending price channel.
The critical level to monitor is the lower boundary of the channel. As long as this support remains intact, the path of least resistance continues to favor the upside. A decisive breakout above 67,200 would strengthen the bullish case, while a breakdown below channel support would be the first meaningful signal that momentum is shifting in favor of sellers.
For long-term investors, corrections within an established uptrend often provide better entry opportunities than buying after sharp rallies.