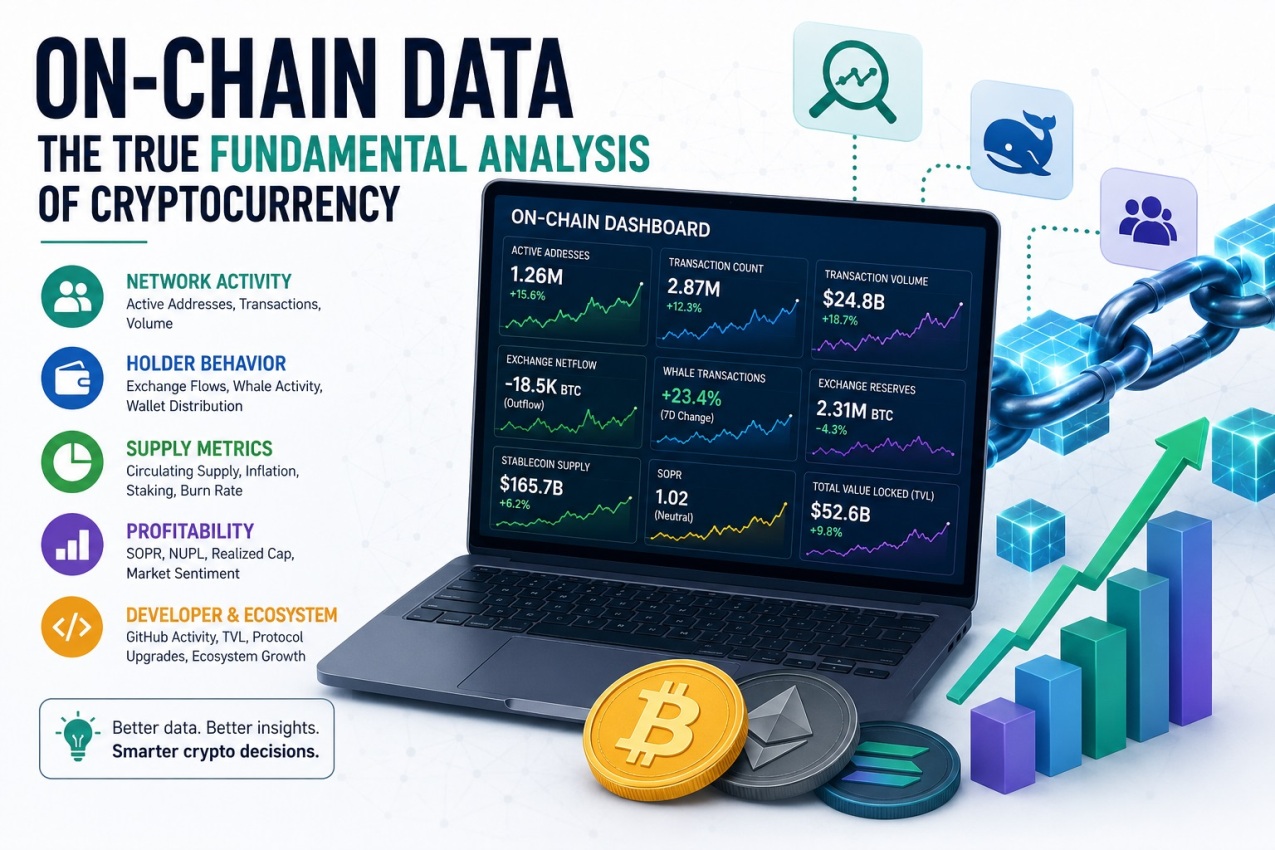
On-chain fundamental analysis is the process of evaluating a cryptocurrency by analyzing data recorded directly on its blockchain. Unlike technical analysis, which focuses on price charts, on-chain analysis examines network activity, investor behavior, and token movement to determine whether an asset is fundamentally strong.
Most traders spend hours studying price charts, but smart crypto investors often focus on something far more powerful, the blockchain itself. On-chain data reveals how many people are using a network, whether whales are accumulating, and if investors are moving funds to exchanges to sell. By understanding these signals, you can evaluate a cryptocurrency’s true fundamental strength before major market moves occur.
-
Analyze Network Activity
Network activity measures how much a blockchain is actually being used. A network with increasing users and transactions is generally healthier than one with declining activity.
Daily Active Addresses (DAA)
This is the number of unique wallet addresses that send or receive cryptocurrency within a day.
Why it matters:
- Shows how many users are actively using the blockchain.
- Increasing DAA often signals growing adoption.
- Falling DAA may indicate reduced interest.
Example:
- Bitcoin has 1.2 million active addresses today compared to 700,000 three months ago. This suggests growing demand.
New Addresses
This counts the number of newly created wallet addresses each day.
Why it matters:
- Measures user adoption.
- A steady increase usually means more people are joining the network.
- A decline could indicate slowing growth.
Example:
If Ethereum creates 250,000 new wallets daily instead of 100,000 previously, adoption is accelerating.
Transaction Count
This is the total number of confirmed transactions processed by the blockchain.
Why it matters:
- Indicates how frequently the network is being used.
- Higher transaction counts often reflect increased economic activity.
Example:
Solana processing 80 million transactions daily suggests high network utilization.
Transaction Volume
This measures the total value of cryptocurrency transferred on-chain.
Why it matters:
- High-value transfers often indicate institutional or whale activity.
- Rising volume usually signals stronger market participation.
Example:
Bitcoin transfers worth $20 billion in one day indicate significant capital movement.
-
Study Holder Behavior
Holder behavior helps determine whether investors are accumulating or preparing to sell.
Exchange Inflows
Coins transferred from private wallets to exchanges.
Why it matters:
People usually move assets to exchanges when they intend to sell.
Bullish or Bearish?
- Large inflows = Bearish.
Example:
100,000 BTC sent to Binance in one day may increase selling pressure.
Exchange Outflows
Coins moved from exchanges into personal wallets.
Why it matters:
Investors often withdraw assets for long-term holding.
Bullish or Bearish?
- Large outflows = Bullish.
Example:
50,000 BTC withdrawn from exchanges suggests accumulation.
Whale Transactions
Transactions made by wallets holding large amounts of cryptocurrency.
Why it matters:
Whales can significantly influence prices.
Example:
A transfer of 8,000 BTC is likely made by a whale or institution.
Wallet Distribution
Shows how the total supply is distributed among different wallet sizes.
Why it matters:
A healthy network generally has broad ownership rather than being concentrated in a few wallets.
-
Check Supply Metrics
Supply metrics reveal whether a cryptocurrency is becoming more scarce or more abundant.
Circulating Supply
The number of coins currently available in the market.
Example:
Approximately 19.9 million BTC are currently circulating.
Maximum Supply
The maximum number of coins that can ever exist.
Example:
Bitcoin’s maximum supply is 21 million BTC.
A fixed supply can increase scarcity over time.
Inflation Rate
The percentage by which new coins are created annually.
Example:
If a blockchain issues 5% more coins each year, holders experience dilution unless demand grows faster.
Burn Rate
Coins permanently removed from circulation.
Why it matters:
Burning reduces supply, potentially increasing scarcity.
Example:
Ethereum burns part of its transaction fees through EIP-1559.
Staking Percentage
The percentage of total supply locked in staking.
Why it matters:
More staked coins mean fewer are available for trading, which can reduce selling pressure.
-
Evaluate Exchange Reserves
Exchange reserves measure how much cryptocurrency exchanges currently hold.
Increasing Exchange Reserves
More coins are available for immediate sale.
Market implication:
Usually bearish.
Decreasing Exchange Reserves
Coins are leaving exchanges.
Market implication:
Usually bullish because fewer coins are available for sale.
-
Monitor Stablecoin Liquidity
Stablecoins represent capital waiting to enter the crypto market.
USDT
The world’s largest stablecoin by market capitalization.
A growing USDT supply often indicates fresh capital entering crypto.
USDC
Widely used by institutions and DeFi platforms.
An increase in USDC circulation may signal institutional buying power.
DAI
A decentralized stablecoin backed by crypto collateral.
Growing DAI supply often reflects increasing DeFi activity.
-
Analyze Realized Profit and Loss
These metrics measure investor profitability.
SOPR (Spent Output Profit Ratio)
Shows whether coins are being sold at a profit or loss.
- SOPR > 1 = Investors are selling at a profit.
- SOPR < 1 = Investors are selling at a loss.
NUPL (Net Unrealized Profit/Loss)
Measures the overall emotional state of the market.
Common phases:
- Capitulation
- Fear
- Hope
- Optimism
- Belief
- Euphoria
High NUPL often suggests the market is becoming overheated.
Realized Cap
Values every coin based on the price at which it last moved rather than the current market price.
This provides a more realistic measure of the capital invested in the network than traditional market capitalization.
-
Check Miner or Validator Activity
This measures the health and security of the blockchain.
Bitcoin
Miner Reserves
The amount of BTC miners are holding.
- Increasing reserves indicate miners expect higher prices.
- Declining reserves suggest miners are selling.
Miner Selling
Tracks how much BTC miners send to exchanges.
Heavy miner selling can increase supply in the market.
Hash Rate
The total computing power securing the Bitcoin network.
Higher hash rate means:
- Stronger network security.
- Greater miner confidence.
Mining Difficulty
Measures how hard it is to mine new Bitcoin.
Increasing difficulty generally means more miners are participating.
Proof-of-Stake Networks
Total Value Staked
The value of coins locked by validators.
Higher values indicate confidence in the network.
Validator Count
The number of active validators.
More validators generally improve decentralization and security.
Staking Ratio
The percentage of supply currently staked.
Higher staking ratios reduce circulating supply.
-
Monitor Whale Activity
Whales often move markets because of the size of their holdings.
Wallets Holding Over 1,000 BTC
Tracks the number of large Bitcoin holders.
An increasing number usually signals accumulation.
Large Transfers
Monitors unusually large on-chain transactions.
A large transfer to an exchange may signal selling.
A large transfer to cold storage often indicates long-term holding.
Institutional Wallet Movements
Tracks wallets associated with ETFs, exchanges, companies, or investment funds.
Growing institutional holdings often strengthen long-term market confidence.
-
Examine DeFi Metrics
These metrics evaluate the health of decentralized finance ecosystems.
Total Value Locked (TVL)
The total value of assets deposited into DeFi protocols.
Higher TVL usually indicates growing trust and usage.
Lending Activity
Measures borrowing and lending volumes.
Increasing lending suggests stronger demand for DeFi services.
DEX Trading Volume
Tracks trading volume on decentralized exchanges.
Higher DEX volume reflects greater on-chain trading activity.
Stablecoin Liquidity
Measures the availability of stablecoins within DeFi protocols.
Greater liquidity supports efficient trading and lending.
-
Assess Developer Activity
Developer activity reflects whether a project continues to improve over time.
GitHub Commits
Tracks how frequently developers update the project’s codebase.
Frequent commits indicate active development.
Number of Active Developers
Measures how many developers contribute to the project.
A larger developer community often leads to faster innovation.
Protocol Upgrades
Includes improvements such as security patches, performance enhancements, or new features.
Successful upgrades can strengthen the network and attract more users.
Ecosystem Growth
Measures expansion beyond the core blockchain, including:
- New decentralized applications (dApps)
- Wallet integrations
- NFT marketplaces
- DeFi protocols
- Gaming projects
- Developer tools
A growing ecosystem generally signals a healthy and sustainable blockchain.
Essential On-Chain Metrics
| Metric | Bullish Signal | Bearish Signal |
| Active Addresses | Increasing | Decreasing |
| Transaction Volume | Rising | Falling |
| Exchange Reserves | Falling | Rising |
| Whale Holdings | Accumulating | Selling |
| Stablecoin Supply | Increasing | Decreasing |
| TVL | Growing | Declining |
| Hash Rate | Rising | Falling |
| Staking Ratio | High | Low |
| SOPR | Near or slightly above 1 after correction | Persistent selling below 1 |
| Burn Rate | High | Low |
Conclusion
No single on-chain metric should be used in isolation. The strongest fundamental analysis comes from combining multiple indicators. For example, if active addresses, transaction volume, exchange outflows, whale accumulation, TVL, and developer activity are all increasing simultaneously, they collectively provide much stronger evidence of a fundamentally healthy cryptocurrency than any one metric alone. This multi-factor approach helps investors distinguish between short-term market noise and long-term trends.
Please DYOR