Cocoa Faces Key Weekly Resistance as Bullish Recovery Continues. After one of the most explosive rallies in commodity market history, cocoa prices are once again at a critical turning point. The recent pullback has left many traders wondering whether the bullish trend is losing momentum or if smart money is simply preparing for the next leg higher. A closer look at the weekly chart reveals several institutional clues that could determine where cocoa heads next.
Asset Overview
- Asset: Cocoa Cash Contract
- Timeframe: Weekly (1W)
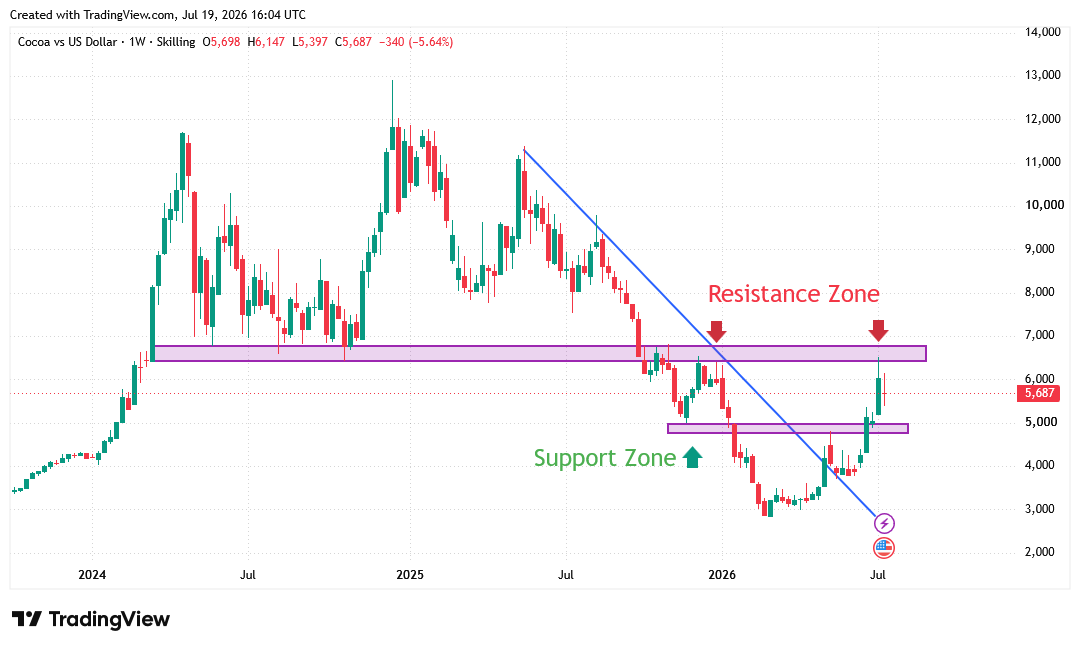
- Current Price: ~5,675
- Market Bias: Bullish recovery within a broader long-term corrective cycle
1. Market Structure
The weekly chart shows four distinct phases.
Phase 1 – Explosive Bull Market (2024)
Cocoa experienced one of the strongest commodity rallies in history, climbing from below 4,000 to nearly 13,800.
Characteristics:
- Strong Higher Highs (HH)
- Strong Higher Lows (HL)
- Institutional momentum buying
Phase 2 – Distribution
Around 12,000–13,800, buyers became exhausted.
The market formed:
- Long upper wicks
- Volatile candles
- Failure to sustain new highs
This is a classic institutional distribution zone.
Phase 3 – Bear Market
From late 2024 into early 2026, cocoa declined steadily.
The market produced:
- Lower Highs (LH)
- Lower Lows (LL)
Institutional sellers controlled this phase.
Phase 4 – Recovery
Beginning around 3,000, buyers stepped in aggressively.
Price has since:
- Broken several weekly swing highs
- Created Higher Lows
- Regained the 5,500–5,700 region
The recovery is constructive, but the market has not yet reclaimed the previous major highs.
2. Change of Character (CHoCH)
The first major bullish CHoCH occurred near 3,200–3,500, where price stopped making lower lows and broke above the previous lower high.
This signaled that bearish momentum had ended and buyers were regaining control.
3. Break of Structure (BOS)
First BOS
Price broke above approximately 4,300, confirming a shift toward bullish momentum.
Second BOS
A later break above 5,000 strengthened the bullish outlook.
The market is now producing:
- Higher Highs
- Higher Lows
on the weekly timeframe.
4. Trend Analysis
Long-Term Trend
Still recovering from the major bear market.
Medium-Term Trend
Bullish.
Short-Term Trend
Bullish with signs of temporary resistance near 6,000.
5. Trendline Analysis
A primary ascending trendline can be drawn:
- Starting from the March 2026 low (~3,000),
- Connecting the subsequent higher low near 4,000,
- Extending toward the recent swing low around 5,000.
As long as price remains above this ascending trendline, the bullish recovery remains valid.
6. Liquidity Analysis
Buy-Side Liquidity
Above:
- 6,200
- 6,800
- 7,500
A breakout through these levels could trigger stop orders and momentum buying.
Sell-Side Liquidity
Below:
- 5,000
- 4,500
- 4,000
These areas contain resting liquidity that could be targeted if the market weakens.
7. Order Blocks
Bullish Weekly Order Block
4,600–5,000
This area preceded the latest impulsive move higher and is the most important institutional demand zone.
Secondary Bullish Order Block
3,600–4,000
Long-term support.
Bearish Weekly Order Block
6,000–6,500
Current supply zone where price is reacting.
8. Fair Value Gaps (FVG)
Visible bullish inefficiencies remain around:
- 4,800–5,100
- 4,200–4,500
These may attract price before another leg higher.
9. Supply and Demand Zones
Demand
Primary:
- 4,600–5,000
Secondary:
- 3,800–4,200
Supply
Primary:
- 6,000–6,500
Secondary:
- 7,200–8,000
10. Support and Resistance
Major Support Levels
- 5,000
- 4,600
- 4,000
- 3,200
Major Resistance Levels
- 6,000
- 6,500
- 7,500
- 8,500
11. Fibonacci Retracement
Using the visible major swing from approximately 3,000 to 6,200:
- 23.6%: ~5,450
- 38.2%: ~5,000
- 50%: ~4,600
- 61.8%: ~4,200
The 38.2% and 50% levels align closely with institutional demand, increasing their significance.
12. Volume
Volume is not visible on the chart.
However:
- Strong bullish weekly candles
- Consecutive impulsive advances
- Reduced size of recent bearish candles
suggest institutional accumulation rather than aggressive distribution.
13. Who Controls the Market?
Long-Term
Neutral to Bullish Recovery
Medium-Term
Buyers
Short-Term
Buyers remain in control, though they are encountering resistance around 6,000.
Highest Probability Trade Setup
Strategy
Buy the pullback into institutional demand.
Aggressive Entry
5,200–5,350
Conservative Entry
4,700–5,000
Wait for:
- Bullish engulfing candle
- Weekly rejection wick
- Break of lower-timeframe structure
Stop-Loss
Below 4,500
Take-Profit Targets
- TP1: 6,200
- TP2: 6,800
- TP3: 7,500
Risk-to-Reward
Approximately 1:3 to 1:4, depending on entry.
Trade Invalidation
A weekly close below 4,500 would weaken the current recovery and increase the probability of a deeper retracement toward 4,000.
Confidence Level
76%
The recovery is supported by improving market structure and multiple bullish breaks of structure, but price is approaching a significant weekly supply zone where sellers may remain active.
Cocoa Faces Key Weekly Resistance as Bullish Recovery Continues
The cocoa market remains one of the most closely watched agricultural commodities after its historic rally and subsequent correction over the past year. The latest weekly chart suggests that buyers are steadily rebuilding momentum, although a major resistance zone continues to cap further gains.
Earlier in the cycle, cocoa surged to record highs as supply shortages, adverse weather conditions, and strong global demand drove prices sharply higher. That rally eventually lost momentum, leading to a prolonged correction that pushed prices down toward the 3,000 level. During this decline, the market consistently formed lower highs and lower lows, confirming a bearish trend.
The technical picture began to improve when cocoa established a base around 3,000 and produced a Change of Character (CHoCH), signaling that sellers were losing control. Subsequent Breaks of Structure (BOS) above key resistance levels confirmed that buyers were returning to the market.
Today, cocoa continues to print higher highs and higher lows on the weekly timeframe, indicating that the medium-term recovery remains intact. However, prices are now approaching a significant supply zone between 6,000 and 6,500, where institutional selling previously emerged. This area is likely to determine whether the recovery extends or pauses for another correction.
From a Smart Money perspective, the most attractive buying opportunities remain in the 4,600–5,000 demand zone. This region aligns with a bullish weekly order block, the 38.2%–50% Fibonacci retracement levels, and previous breakout structures, making it a high-probability area for institutional accumulation if the market retraces.
On the upside, a sustained break above 6,500 would strengthen the bullish outlook and could open the door for advances toward 7,500 and eventually 8,500. Until then, traders should monitor price action closely for confirmation before committing to new positions.
Overall, the weekly chart suggests that cocoa is transitioning from a recovery phase into a potential longer-term uptrend. While short-term volatility is expected around current resistance, the broader technical structure continues to favor buyers as long as prices remain above the key support region near 4,500–5,000.
Please DYOR.